Statistical Analysis Software Product List and Ranking from 6 Manufacturers, Suppliers and Companies | IPROS

Last Updated: Aggregation Period:Aug 05, 2026~Sep 01, 2026
This ranking is based on the number of page views on our site.

Statistical Analysis Software Manufacturer, Suppliers and Company Rankings

Last Updated: Aggregation Period:Aug 05, 2026~Sep 01, 2026
This ranking is based on the number of page views on our site.

  1. SAS Institute Japan JMP Japan Division Tokyo//others
  2. B7 Tokyo//Information and Communications
  3. アイスタット Tokyo//Information and Communications
  4. 4 スマート・アナリティクス Tokyo//Information and Communications
  5. 4 ライトストーン Tokyo//Information and Communications

Statistical Analysis Software Product ranking

Last Updated: Aggregation Period:Aug 05, 2026~Sep 01, 2026
This ranking is based on the number of page views on our site.

  1. JMP SAS Institute Japan JMP Japan Division
  2. JMP Pro SAS Institute Japan JMP Japan Division
  3. JMP is not just for analysis! Ways to utilize data processing, automation, and visualization. SAS Institute Japan JMP Japan Division
  4. Medical statistical analysis software 'MedCalc' B7
  5. 4 Technical Seminar: Practical Use of Data in Manufacturing Industry SAS Institute Japan JMP Japan Division

Statistical Analysis Software Product List

1~13 item / All 13 items

Displayed results

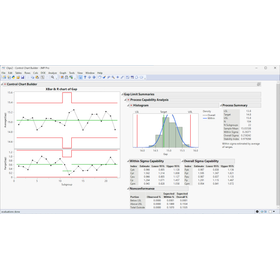
JMP Pro

Sophisticated methods for conducting advanced analysis.

JMP Pro is software that adds advanced analytical capabilities to JMP. The statistical analysis software JMP Pro, provided by SAS, is designed for scientists and engineers, and it includes many advanced techniques in addition to the excellent features familiar in JMP, such as visual data access, data manipulation, interactive operation methods, rich analytical functions, and scalability. Furthermore, JMP Pro offers a variety of advanced tools. It includes predictive modeling with validation features using numerous different techniques, state-of-the-art modeling methods, model comparison and averaging, advanced multivariate analysis, reliability block diagrams, coverage arrays, mixed models, uplift models, and statistical methods utilizing advanced calculators. With JMP Pro, you can perform advanced and diverse analyses, helping to remove barriers that hinder statistical discoveries and uncover clues hidden in the data. This allows you to more quickly find breakthroughs to problems and anticipate and control the future.

  • BI Tools
  • Process Control System
  • Statistical Analysis Software

Added to bookmarks

Bookmarks list

Bookmark has been removed

Bookmarks list

You can't add any more bookmarks

By registering as a member, you can increase the number of bookmarks you can save and organize them with labels.

Free membership registration

Technical Seminar: Practical Use of Data in Manufacturing Industry

Statistical Analysis Software JMP: Quality and Process Improvement Practiced by User Companies (Case Studies)

In the manufacturing industry, while a large amount of quality and process data has been accumulated, there are still many cases where its value is not fully utilized. In this seminar, we will present case studies from two companies that are working on data analysis and improvement activities using JMP. From Energy With Co., Ltd., we will introduce their efforts to utilize vast inspection data to connect quality assurance with quality and process improvement. Additionally, Atfields Technology Co., Ltd. will share their approach and key points for discovering issues and leading to improvements through practical data analysis using JMP. This presentation will be given by individuals who are actively engaged in data analysis related to product and technology development using JMP. We look forward to the participation of many people in this seminar, which aims to provide hints for utilizing data in manufacturing sites. 【Target Participants】 - Individuals involved in quality control, quality assurance, production technology, manufacturing technology, etc., in the manufacturing industry - Those who want to utilize quality data and process data to work on quality and process improvement - Individuals interested in data analysis and quality/process improvement using JMP (both JMP users and non-users are welcome)

  • Other Software
  • Statistical Analysis Software

Added to bookmarks

Bookmarks list

Bookmark has been removed

Bookmarks list

You can't add any more bookmarks

By registering as a member, you can increase the number of bookmarks you can save and organize them with labels.

Free membership registration

Multivariate Statistical Analysis Training Seminar held in Fushimi, Kyoto + Online participation available

It demonstrates its power in discovering and clarifying the information and interrelationships hidden in big data, quickly solving problems in various fields!

We are holding training courses on topics such as multivariate statistical analysis, spectral analysis, experimental design and optimization, analysis of sensory and perceptual data, and PAT. You can choose to attend the training course in Fushimi, Kyoto, or online! ■ Start Date: December 9 (Thursday) to 10 (Friday) for two days This course focuses on the operational capabilities of multivariate statistical analysis, which are highly sought after in industry and research. Participants will acquire the ability to quickly interpret complex data relationships and apply new multivariate statistical analysis techniques in their work. Mathematical explanations are kept to a minimum, and the content is practical. Upon completion of this course, you will be able to smoothly apply multivariate statistical analysis for product and process optimization, difference analysis and classification, and predictive quantification. We also conduct group training and in-house seminars. 【Training Course Content】 - What is multivariate analysis? - Regression analysis - Principal Component Analysis (PCA) - Validation - Outliers - Prediction of unknown samples - Data checking - Outliers in regression analysis *For more details, please refer to the PDF document or feel free to contact us.

  • Other Software
  • Scientific Calculation and Simulation Software
  • Non-destructive testing
  • Statistical Analysis Software

Added to bookmarks

Bookmarks list

Bookmark has been removed

Bookmarks list

You can't add any more bookmarks

By registering as a member, you can increase the number of bookmarks you can save and organize them with labels.

Free membership registration

Multivariate Statistical Analysis Software VEKTOR

Vector is a multivariate statistical analysis software that supports various types of data! It enhances usability and enables data visualization.

"VEKTOR DIREKTOR" is a user-friendly multivariate statistical analysis software that supports various types of data and enables data visualization. From data import to prediction and classification, this product allows for effective data analysis through an intuitive workflow. It can execute the analyzed calibration models in real-time, enabling real-time monitoring and the construction of feedback/forward control systems. With comprehensive preprocessing aimed at spectral analysis, it can be comfortably used not only for big data analysis using process parameters but also for chemometrics. By providing only the methods frequently used by customers, it allows for maximizing the use of data with the appropriate tools. 【Features】 ■ Easy data import ■ Effective visualization ■ Comprehensive data preprocessing functions ■ Diverse analysis tools *For more details, please refer to the PDF materials or feel free to contact us.

  • Other Software
  • Statistical Analysis Software

Added to bookmarks

Bookmarks list

Bookmark has been removed

Bookmarks list

You can't add any more bookmarks

By registering as a member, you can increase the number of bookmarks you can save and organize them with labels.

Free membership registration

JMP

Analyze visually and interactively.

JMP, developed by SAS, has been used as a tool for statistical discovery by scientists, engineers, and people in various industries and government sectors engaged in data exploration. JMP is a desktop software that combines dynamic data visualization with powerful statistical capabilities, processing data in-memory. With interactive and visual JMP, it is possible to gain insights that cannot be obtained from mere tables of numbers or static graphs. In JMP, graphs, statistics, and data are all linked. This allows for deeper exploration of thoughts and leads to groundbreaking discoveries. JMP enables users to perform analyses in succession while staying in the flow of analysis. You can explore while maintaining the flow of the analysis, and there is no need to re-execute commands when new questions arise. Using JMP significantly improves the efficiency of data analysis, making it easy to handle everyday tasks and complex statistical problems, while also effectively communicating the results of the analysis.

  • Construction and process management software
  • Big Data
  • Scientific Calculation and Simulation Software
  • Statistical Analysis Software

Added to bookmarks

Bookmarks list

Bookmark has been removed

Bookmarks list

You can't add any more bookmarks

By registering as a member, you can increase the number of bookmarks you can save and organize them with labels.

Free membership registration

"JMP Statistical Analysis Software: Basics of Experimental Design" Hands-on Seminar

For researchers and technology developers in the manufacturing industry! Start with no-code experimental design (DOE).

This is an introductory seminar to learn the basic operations of JMP's "Design of Experiments (DOE)." Anyone can participate, regardless of industry, job type, or experience with design of experiments. You will be able to experience the basic operations and functions of design of experiments while actually operating JMP on your own device, following the instructor's explanations and the provided text (PDF version). [Content] The seminar will focus on explaining the procedures for creating experimental designs, entering experimental data, fitting models, and visualizing results (such as contour plots and response surfaces) using JMP. JMP's "Custom Design" is a flexible experimental design creation feature that supports screening experiments and optimization experiments. It allows for the combination of various types of factors, such as continuous factors, categorical factors, and mixture factors, and can also create experimental designs with constraints on factors. In this seminar, we will introduce these features and how to utilize them while actually creating experimental designs using "Custom Design." If you do not have JMP, you can participate using a 30-day free trial version. Trial: https://www.jmp.com/ja/download-jmp-free-trial

  • Other Software
  • Statistical Analysis Software

Added to bookmarks

Bookmarks list

Bookmark has been removed

Bookmarks list

You can't add any more bookmarks

By registering as a member, you can increase the number of bookmarks you can save and organize them with labels.

Free membership registration

JMP is not just for analysis! Ways to utilize data processing, automation, and visualization.

Doesn't it bother you that 'data processing takes time,' 'you are repeating the same tasks every time,' and 'creating graphs is surprisingly difficult'?

As the importance of data utilization increases, a significant amount of time is spent on tasks such as data processing and graph creation. Particularly in spreadsheet software, errors due to repetitive manual work are often a challenge. JMP not only offers advanced statistical analysis but also has a wealth of features for data preprocessing and visualization. In this seminar, we will introduce methods to streamline data operations, from data loading and processing to graph creation and automation. 【Target Audience】 - Individuals across various industries who regularly process and graph data using spreadsheet software. - Those who find the monthly or weekly report and graph creation cumbersome. - Individuals who want to streamline data preparation tasks and spend more time on analysis and reporting. - Those interested in learning how to utilize JMP not only for analysis but also for data preprocessing and visualization. 【Main Content】 - Loading various tabular data formats - Streamlining data processing and formatting - Automating routine tasks - Creating expressive graphs * Content is subject to change. * This will be a format where you can watch the instructor's explanations and demonstrations.

  • Other Software
  • Statistical Analysis Software

Added to bookmarks

Bookmarks list

Bookmark has been removed

Bookmarks list

You can't add any more bookmarks

By registering as a member, you can increase the number of bookmarks you can save and organize them with labels.

Free membership registration

Statistical analysis software 'Stata 16'

Applicable to a wide range of research across various fields and industries, including econometrics, social statistics, and medical statistics!

"Stata 16" is an integrated statistical software that allows for statistical analysis, data management, graph output, and automatic report generation. It features advanced analytical methods such as Lasso, nonlinear DSGE models, meta-analysis, and choice models. There is a progression in the integration of existing functions, such as extended regression models that handle endogeneity and Bayesian analysis, enabling advanced dimensional analysis. 【Features】 ■ Simple operability ■ Comprehensive documentation ■ High-quality technical support ■ Accuracy and reliability ■ Integrated package, etc. *For more details, please download the PDF or feel free to contact us.

  • Other Software
  • Scientific Calculation and Simulation Software
  • Statistical Analysis Software

Added to bookmarks

Bookmarks list

Bookmark has been removed

Bookmarks list

You can't add any more bookmarks

By registering as a member, you can increase the number of bookmarks you can save and organize them with labels.

Free membership registration

Statistical analysis software "Multi Forecast"

Add-in software that can analyze data entered in an Excel sheet.

"Multi-Prediction" is a statistical analysis software that allows for the direct analysis of Excel data and enables predictions using the EPA method and multivariate analysis. The software automatically selects existing multiple regression analysis, Quantification Type I, and an extended version of Quantification Type I to create prediction model formulas. Furthermore, the data used in the prediction model formulas can be analyzed even if it consists of a mix of quantitative and qualitative data. Please feel free to contact us if you have any requests. 【Features】 ■Basic Analysis ■TCSI Separation ■Trend Analysis ■Factor Analysis - Multiple Regression, Type I, Extended Type I ■Factor Analysis - Prediction Model Formula *For more details, please download the PDF or feel free to contact us.

  • Analysis and prediction system
  • Store Analysis System
  • Other Software
  • Statistical Analysis Software

Added to bookmarks

Bookmarks list

Bookmark has been removed

Bookmarks list

You can't add any more bookmarks

By registering as a member, you can increase the number of bookmarks you can save and organize them with labels.

Free membership registration

Statistical analysis software "Multi Multivariate"

Equipped with multivariate analysis capable of causal relationships, predictions, and segmentation.

"Multivariate Analysis" is a statistical analysis software that allows for the analysis of causal relationships, predictions, segmentation, positioning, similarity analysis, and more using Excel data. Regarding predictions, it can analyze data on Excel sheets, including survey data, time series data, experimental data, quantitative data, and qualitative data (categorical data). Please feel free to contact us if you have any requests. 【Main Analysis Methods】 ■ Various basic statistics, cross-tabulation, category-wise averages ■ Correlations (simple correlation coefficients, correlation ratios, Cramér's V), named correlation diagrams ■ Multiple regression analysis, multiple logistic regression analysis, discriminant analysis ■ Quantification Type I, extended Quantification Type I, Quantification Type II, extended Quantification Type II ■ Principal component analysis, factor analysis, Quantification Type III, correspondence analysis, cluster analysis, etc. *For more details, please download the PDF or feel free to contact us.

  • Analysis and prediction system
  • Store Analysis System
  • Other Software
  • Statistical Analysis Software

Added to bookmarks

Bookmarks list

Bookmark has been removed

Bookmarks list

You can't add any more bookmarks

By registering as a member, you can increase the number of bookmarks you can save and organize them with labels.

Free membership registration

Medical statistical analysis software 'MedCalc'

From research to clinical practice, MedCalc transforms medical data into reliable insights.

MedCalc is a comprehensive statistical software specifically designed for biomedical sciences. This software combines statistical analysis features with a user-friendly interface, making it accessible for both beginners and advanced users in medical statistics. MedCalc simplifies the complexities of medical statistics into straightforward answers. 【Features (partial)】 ■ Easily perform complex medical statistical analyses with an intuitive interface ■ Accurately assess the accuracy of diagnostic tests through ROC curve analysis ■ Visually confirm the consistency between measurement methods with Bland-Altman plots ■ Evaluate treatment effects and prognosis over time with survival analysis features ■ Integrate and analyze multiple research results with meta-analysis capabilities ■ Precisely calculate the necessary sample size for studies with sample size calculation features *For more details, please refer to the related links or feel free to contact us.

  • Company:B7
  • Price:Other
  • Scientific Calculation and Simulation Software
  • Statistical Analysis Software

Added to bookmarks

Bookmarks list

Bookmark has been removed

Bookmarks list

You can't add any more bookmarks

By registering as a member, you can increase the number of bookmarks you can save and organize them with labels.

Free membership registration

Statistical analysis software IBM SPSS Statistics

The standard software for statistical analysis "IBM SPSS Statistics" allows you to perform various statistical processes using just menu operations!

The biggest feature of IBM SPSS Statistics is that advanced statistical analysis, graph creation, and data manipulation can all be performed simply by operating the menu. Anyone can easily conduct analysis without having to write any programs. SPSS Statistics provides a data view similar to spreadsheet software and a variable view for setting each variable. It also offers numerous data preparation and data manipulation functions necessary for data analysis. It covers not only commonly used statistical analysis methods in research fields but also statistical methods used in areas such as medical statistics. Advanced statistical analysis methods can be explored simply by clicking through the menu. SPSS Statistics is used by over 300,000 users worldwide, including in Japan. It is software that is widely utilized in numerous papers and academic research. In addition to the high reliability of analysis results, there is a supportive environment for beginners, including related books and comprehensive training courses.

  • Other Software
  • Statistical Analysis Software

Added to bookmarks

Bookmarks list

Bookmark has been removed

Bookmarks list

You can't add any more bookmarks

By registering as a member, you can increase the number of bookmarks you can save and organize them with labels.

Free membership registration

Event/Seminar

If you're looking for a seminar for those using SPSS, leave it to us!

Our company hosts a variety of events and seminars, ranging from free product introductions to paid seminars. We offer a free online training course titled "Introduction to SPSS from Scratch" and live online seminars such as "Specialized Statistics Course - Basics of Sample Size and Case Number Design" for clinical research and survey research. Additionally, we hold free consultation days where you can discuss anything related to statistical analysis, SPSS, or data analysis for 30 minutes at no charge. 【Seminars and Training Courses (Examples)】 ■ Introduction to SPSS from Scratch ■ SPSS Tips and Tricks Seminar ■ First-Time SPSS Introduction ■ First-Time SPSS AMOS Introduction ■ Introduction to Statistics for Beginners *For more details, please download the PDF or feel free to contact us.

  • Employee training
  • Statistical Analysis Software

Added to bookmarks

Bookmarks list

Bookmark has been removed

Bookmarks list

You can't add any more bookmarks

By registering as a member, you can increase the number of bookmarks you can save and organize them with labels.

Free membership registration